Combining dependencies with commit information
As part of an internship project, we experimented with finding dependencies that are both important and have few maintainers, based on their public source code repositories and deps.dev dependency graphs.
Modern software development heavily relies on open source libraries to reduce
effort and speed up innovation. However, alongside the many benefits,
third-party open source libraries can introduce risk into the software supply
chain, and modern ecosystems make it easy to end up pulling in tens, if not
hundreds of dependencies. Given limited resources, which dependencies should
developers focus on to mitigate the risk of supply-chain attacks? Which
dependencies might be exposed to more risk of
single points of failure? In other words, we want to
not only consider the likes of numpy, but also
explore the well-hidden 30LoC single-author packages that everyone depends on.
Dependency graphs
Deps.dev provides resolved dependency graphs for packages in several ecosystems. These graphs can be complex and can include thousands of direct and indirect dependencies.
A package’s deps.dev page (for example react) also includes
information on the package’s dependents (the open source packages that include
the package as a dependency). This information can help us narrow our focus to
important packages - those with many direct or indirect dependents. The number of
dependents is a good starting metric, and it is already used as part of one
prior importance measure for repos called the
OpenSSF Criticality Score.
But which of these important packages might be susceptible to the risks of a
single maintainer?
Dependency graphs are more powerful with more data
Let’s look at a hypothetical example dependency graph, and see how both the
package dependency graph and contributor commits to an associated repository
can be combined to help developers focus on
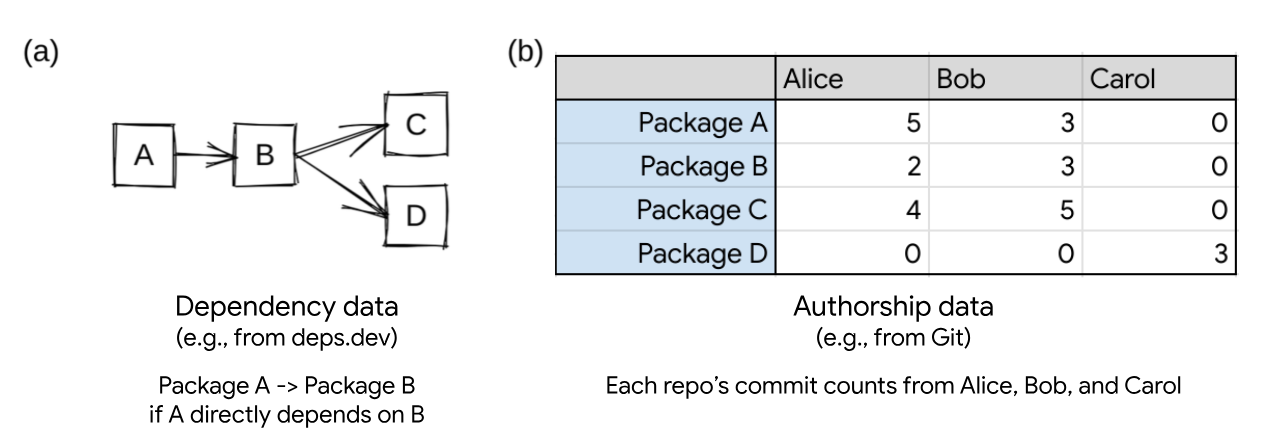
interest-worthy packages in their supply chains. Suppose that all of a
developer’s open source software (OSS) dependencies can be mapped to four repos:
A, B, C, and D. This is shown graphically in figure (a).
If we only consider the dependency data, C and D are the most important packages
in the ecosystem. They have the largest number of dependents. If an attacker
were to introduce a vulnerability in either C or D, more packages within the
ecosystem will be compromised than if a vulnerability is introduced in A or B.
Similarly, if B were to become unmaintained or no longer updated, it could block
the adoption of any vulnerabilities fixed in C or D.
In our example case, we consider not only dependency information, but authorship
information as well (shown in figure (b)), derived from source code commit information.
In this case, a special pattern emerges: repo D is solely authored by Carol,
while A, B, and C are all authored collaboratively by Alice and Bob.
When we consider this commit information, repo D becomes quite interesting
because it could represent a higher level of risk. All the work of securing repo
D, including coordinating security upgrades, falls to a single developer. In
general, it is good to have more eyeballs reviewing changes (“Linus’s
law”), or to have additional
developers performing upkeep.
In other words, repo D seems important because its authorship is unique and has
multiple dependents (both A and B). If we were to rank these packages in order
of importance for the supply chain, we could say that D > C > B > A. But is
there a way to compute this?
Modeling our intuition
Given our intuition, how do we concretely model a ranking of repos when we might have thousands of repos and tens of thousands of authors? To put it in computer science terms, we can map this to defining a scalable node importance score (“node centrality”) and a way to construct a graph using both dependency and authorship data.
Looking at our original dependency graph (figure (a)), imagine a walker is
placed on a random node and always travels in the direction of the arrows. The
walker randomly chooses an arrow to follow; if there are no arrows to follow,
the walker stops. 50% of the time the walker will end up at C and 50% of the
time the walker will end up at D. This “random walk” notion of node importance
yields C and D being the most important nodes in the graph. Intuitively, C and D
are the “most upstream” nodes and attacking them will have the highest impact on
the ecosystem, and edges in the graph represent the delegation of security risk
and best practices. The more upstream a node is, the more repos have delegated
their risks to the node.

Let’s play with the concept of A, B, and C being related to each other because
they share their distribution of authors. The natural way to model relationships
in a graph is to add edges. We take a simplistic assumption that when repos
share authors, they tend to have similar security practices and quality. To
model this similarity we add bidirectional edges among all pairs in A, B, and C.
This gives us a new graph that not only takes into account dependency
information but also authorship information (figure (c)). Reusing our random
walker analogy, it is possible for the walker to reach D from any other node,
but once our walker is at D, it can no longer travel to another node. We see D
as the most important node in the graph: any random walker will eventually land
in D with 100% probability and be unable to escape.
The above argument captures our intuition to use the well-known PageRank algorithm as the measure of node importance. PageRank models a walker starting randomly choosing edges to follow in the graph. The more often a node is visited, the higher its importance. By adding shared authorship edges to the dependency graph, PageRank tends to highlight single point of failures in the graph.
Applying to real data
We expanded upon this idea and added weights to the edges in a Python implementation. Then a test run was performed on a sub-ecosystem of our open source usage (a graph of ~500 nodes and ~10k edges). We were able to confirm the general trend: using source code commit data highlights important packages with potential single point of failures better. Let’s take a closer look at a small case study from our analysis that includes the following four packages:
golang/protobufadds support for protocol buffers in Go. Although it has been deprecated, it is still alive and healthy. It has a variety of contributors.josharian/internis a Go library to store the same strings in the same memory location. It has widespread usage and is largely written by a single person.numpy/numpyis a very popular numerical library for Python. It is active and healthy, with many contributors.google/go-cmpis a utility library to compare values for testing in Go. It is popular and largely written by a single person.
Here are the relative PageRank ranks of these four packages before and after introducing authorship data:
| Rank only w/ Dependency | Rank w/ Dependency + Coauthorship | |
|---|---|---|
| golang/protobuf | 1 | 2 |
| josharian/intern | 2 | 1 |
| numpy/numpy | 3 | 4 |
| google/go-cmp | 4 | 3 |
Table: Ranks of packages before and after introducing shared-authorship data; lower rank means higher relative importance.
Notably, josharian/intern and google/go-cmp have fewer contributors than the
other two packages, and thus rank higher when we consider both dependency and
co-authorship.
More can be done with deps.dev
Deps.dev provides data to enable developers to perform data-driven decisions to secure their supply chains. On top of deps.dev, developers and researchers can supply additional data to customize the packages they focus on. We showed that using source code commit data we can additionally identify potential single point of failures in the supply-chain. All of the dependency data mentioned is publicly available via the deps.dev API and BigQuery datasets, while authorship data can be obtained from the source code repositories associated with the packages.
Open source provides a wealth of data, and we welcome research ideas related to network analysis or general data science that can help unlock new insights about this important resource. If you have any research ideas or feedback, please open an issue or contact us at depsdev@google.com.
This work was performed as part of a Google internship program. If you’re interested in working on open source security, we encourage you to apply to Google’s internship program!